 AI Assistant for reporting
FAQ (beta)
AI Assistant for reporting
FAQ (beta)
This topic covers frequently asked questions about the AI Assistant for reporting.
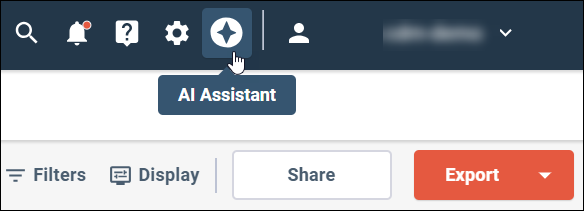
How do I access the AI Assistant?
The AI Assistant for modern reports is only accessible when you have a modern report open.
- Open a modern report in the Surveys app.
- In the navigation bar,
click
AI Assistant.
How is generative AI implemented for the AI Assistant?
The AI Assistant is hosted in AWS Bedrock. AWS Bedrock is a managed service that provides enterprise security, privacy, and performance. Your data is not used to train or improve generative AI models.
Does the AI Assistant store my conversations, and if so, for how long?
Yes, you can access and resume previous conversations with the AI Assistant in the History tab. Conversations are stored for 7 days, and are associated with the report where the conversation occurred. Conversations are not shared globally between all your reports.
Can the AI Assistant access profile variables?
The AI Assistant can recognize and comment on profile variable data when it is presented alongside survey data, provided that the profile variable is included in the report in a crosstab or banner. However, the Assistant cannot be queried about profile variables that are not used in the report.
How can I use my company's branding in AI generated visualizations?
You can request that the AI Assistant use the specific color and fonts required by your brand. You can have the assistant apply them to a specific visualization, or all visualizations in the report. For example: Please use my brand colors (#FF8600, #24B75F, #1BA5FA, #FF1A00), and Arial font for all visualizations in this report.
How can I learn how a visualization can be customized?
You can ask the AI Assistant to provide information on how a specific visualization, or visualization type can be customized. For example: How can I customize the Age Group Distribution visualization?
The AI Assistant lists the aspects of the visualization you can customize and suggests prompts you can use to apply customizations. For example:
- "Change the chart type to a pie chart"
- "Add a subtitle: 'Survey Results from Summer 2025'"
- "Add a legend at the bottom of the chart"
For more general information on supported visualizations and the settings you can change, see AI Assistant for reporting: Visualization capabilities (beta).
How can I retain my customizations between conversations or reports?
Currently, an approach you can use is to ask the AI Assistant to create the prompt you can use. You can tailor your question to include the properties of global settings and individual visualizations that you have customized. For example: Can you output a prompt I can use to apply the following settings to other reports: 1) brand colors and fonts for all visualizations, and 2) pie charts specifically.
You can cut and paste the prompt the AI Assistant response with for use in other reports, or for future sessions with the same report.
Is there anything I can do to optimize AI Assistant responses?
Yes, you can add your research goals to the report to provide customized information about your survey to the AI Assistant that it can use to inform its responses.
To supply your research goals in the report, add a text tile to the top of the report and cut and paste or type in your goals. When the AI Assistant processes the report it will incorporate this information into its analysis.
What are known limitations of the AI Assistant?
- Short Answer
- Long Answer
- Number
- Date
- Zip / Postal Code
- Phone Number