 Adding banners to modern
report crosstabs
Adding banners to modern
report crosstabs
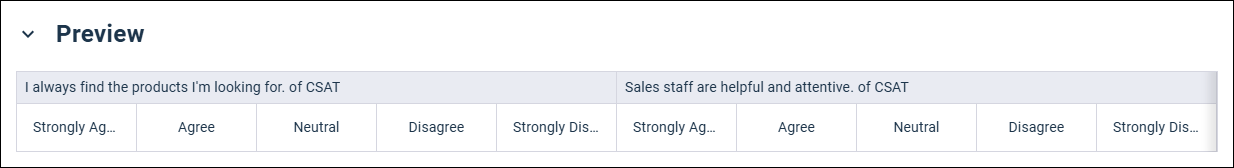
Use banners to compare results from different segments in the same view.
Banners enable you to answer questions about your data by viewing a crosstab report that groups your results by one or more segments, or categories. For example, you may reveal insights in your report by segmenting each question's responses by gender.
You can reorder answers in banners and show and hide answers when you add banners.
Banners are defined using answers to survey questions or profile variables.
The following survey question types and response data fields, which are automatically added to all surveys, are supported:
- Single Choice
- Single Choice Grid
- Multiple Choice
- Multiple Choice Grid
- Rating
- Display Type (Response Data)
- Respondent Locale (Response Data)
- Response Status (Response Data)
- Dataset Type (Response Data)
The following profile variable types are supported:
- Single Choice
- Multiple Choice
You can also add Group Answer, Group Dates, and Group Time Periods recode fields as banners.
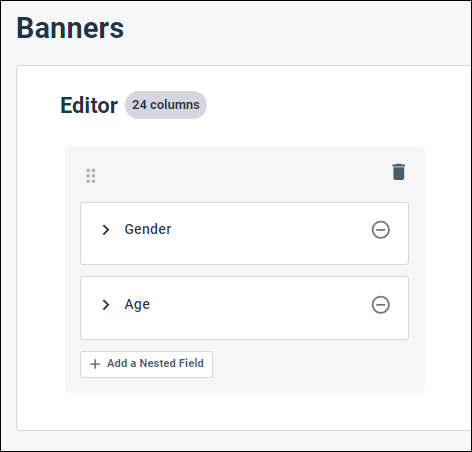
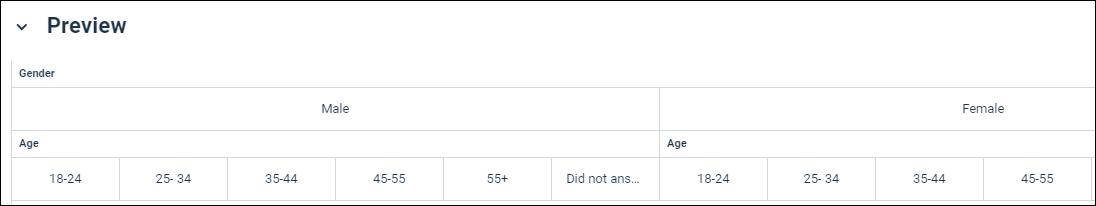
Nested banners
You can use nested banners to segment each crosstab into multiple levels. You can add one or two nested banners under a top-level banner. This enables you to examine the results for multiple questions or profile variables simultaneously.
| Example: A crosstab with a nested banner |
|---|
You have a survey where the questions are displayed in crosstabs segmented by gender. You want to drill down into your data and also view each gender segmented by age group.
|
Single Choice Grid and Multiple Choice Grid questions in banners
When you add Single Choice Grid and Multiple Choice Grid questions as banners, you need to add each of the individual questions associated with grid question that you want to include as a banner.
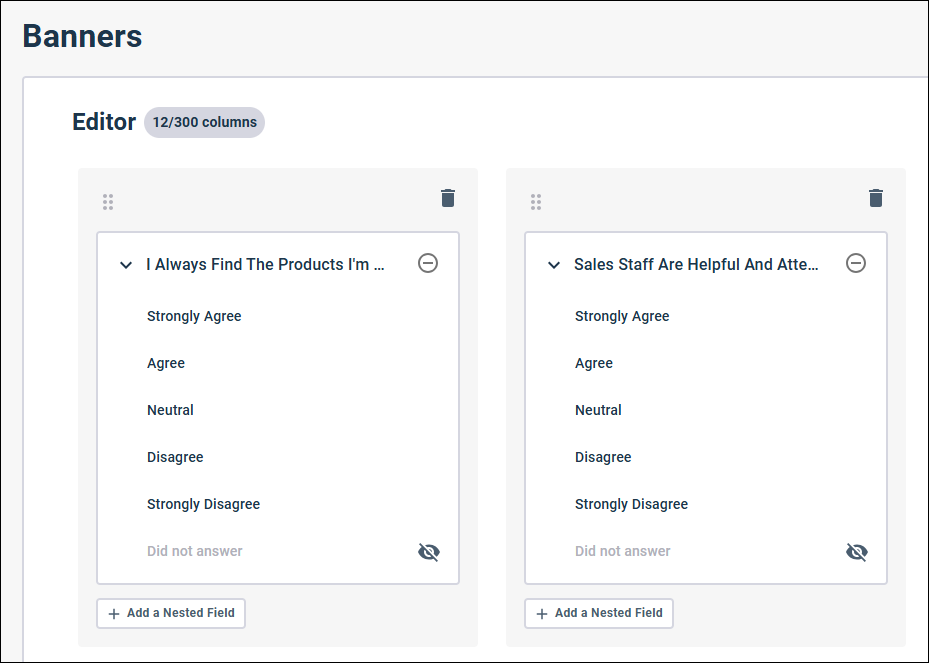
A banner column is added for each question, and the answers to the question are added as nested banners.
Using banners to view multiple response results over time
You can use banners to segment multiple response surveys by time period. You can use the Group Dates recode to segment the Response Completed Date field by month, year, or another time period and add the recode as a banner. If your multiple response survey includes a question for recording the wave value of responses, you can also use a banner to segment your results using this question.
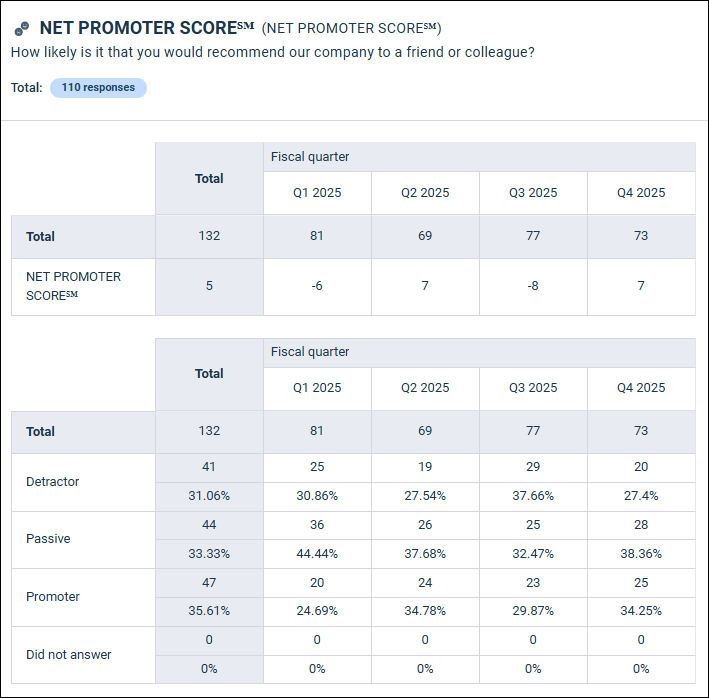
| Segment Net Promoter Score results by fiscal quarter |
|---|
You want to survey your customers each quarter to gauge their level of satisfaction over time. First, you create your multiple response survey with a hidden single choice question to record the fiscal quarter the survey was completed in. Next, over several quarters you distribute your survey and receive
responses. To capture the fiscal quarter value of each response you append the
value to the distribution link. For example, for Q1 2025 you append:
Finally, in your modern report you add a banner based on the Fiscal quarter question to view the NPS® results broken out by quarter.
|