 Configure grid and Rank
Order question tiles
Configure grid and Rank
Order question tiles
You can configure Single Choice Grid, Multiple Choice Grid, and Rank Order questions to display a single summary chart for all statements and answers, individual crosstabs for each statement, or both.
The Summary tab displays all of the statements and answers or ranks in a single, easy to consume table. A heatmap visually highlights differences in the range of values.
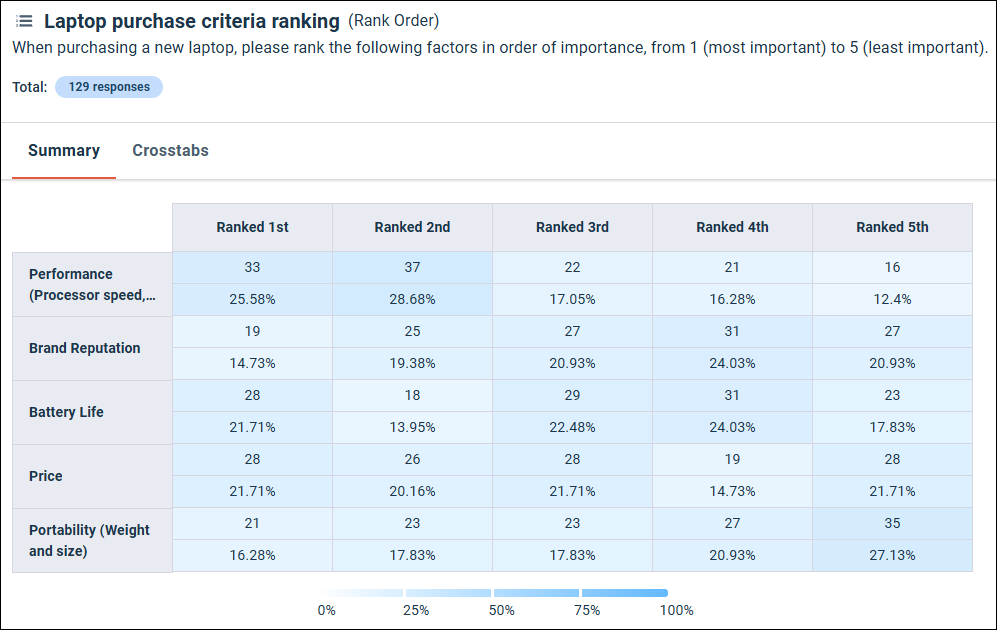
You can modify the values in the table to show percentages only, counts only, or both by modifying the Display settings in the report toolbar. For more information, see Configure crosstab and summary table display settings.
Configure the Summary tab
You can choose to show or hide the Summary tab, and select the orientation of the table.
-
Click the options menu for the Grid or Rank Order tile you want
to configure, and select
Tile Settings.

Configure the Crosstabs tab
You can display a crosstab for each statement in the grid or Rank Order question. You can also choose not to display this tab.
-
Click the options menu for the Grid or Rank Order tile you want
to configure, and select
Tile Settings.