 Grid and Rank Order
question views in modern reports
Grid and Rank Order
question views in modern reports
Single Choice Grid, Multiple Choice Grid, and Rank Order questions offer a specialized dual-tab layout.
By default, the results for these three question types are displayed in two tabs:
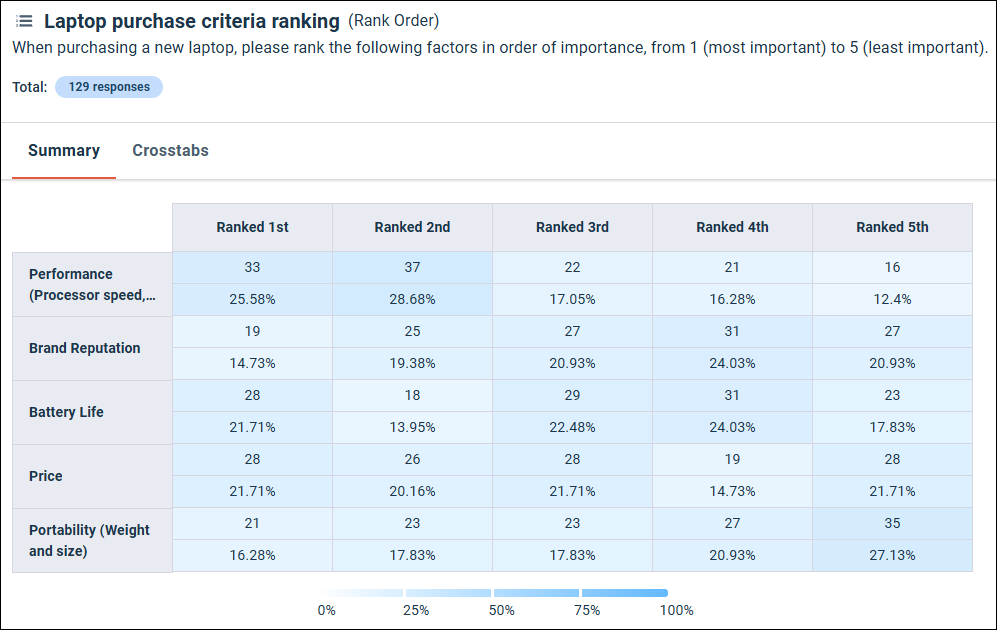
- Summary tab: This tab displays a consolidated table with statements as rows and answers/ranks as columns. A heatmap is applied to the table, using color shading to visualize percentage differences between values. You can toggle the orientation to display statements as columns and answers as rows if preferred.
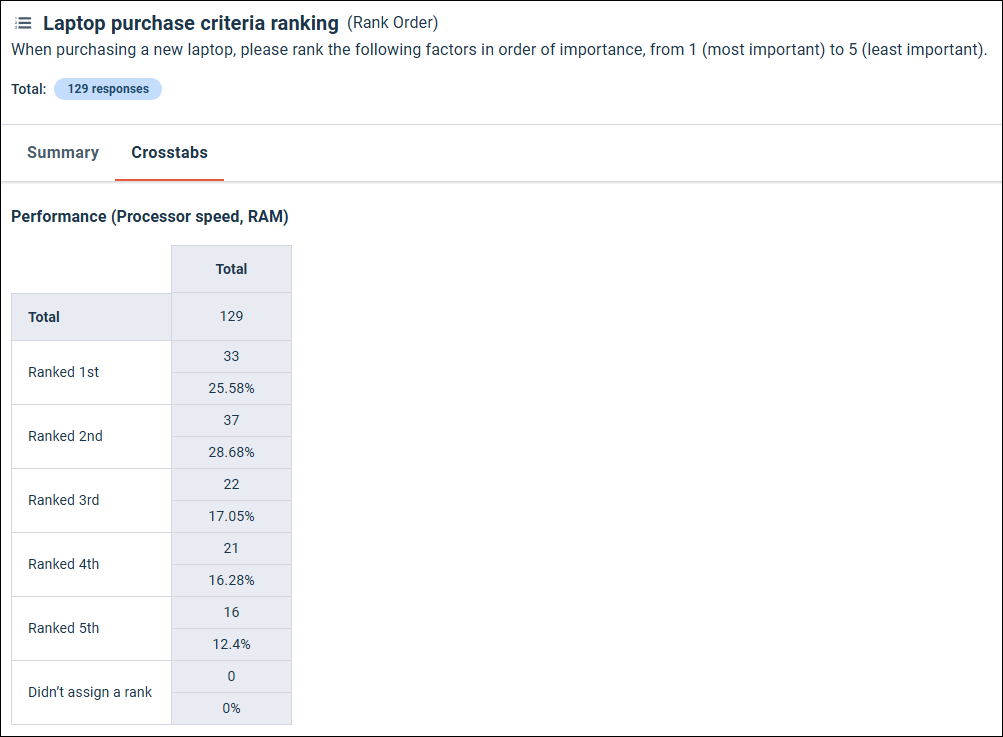
- Crosstabs tab: This tab displays a separate, individual crosstab for each statement.
You can display either one of the tabs or continue to display both of them.
Summary tab
Crosstabs tab
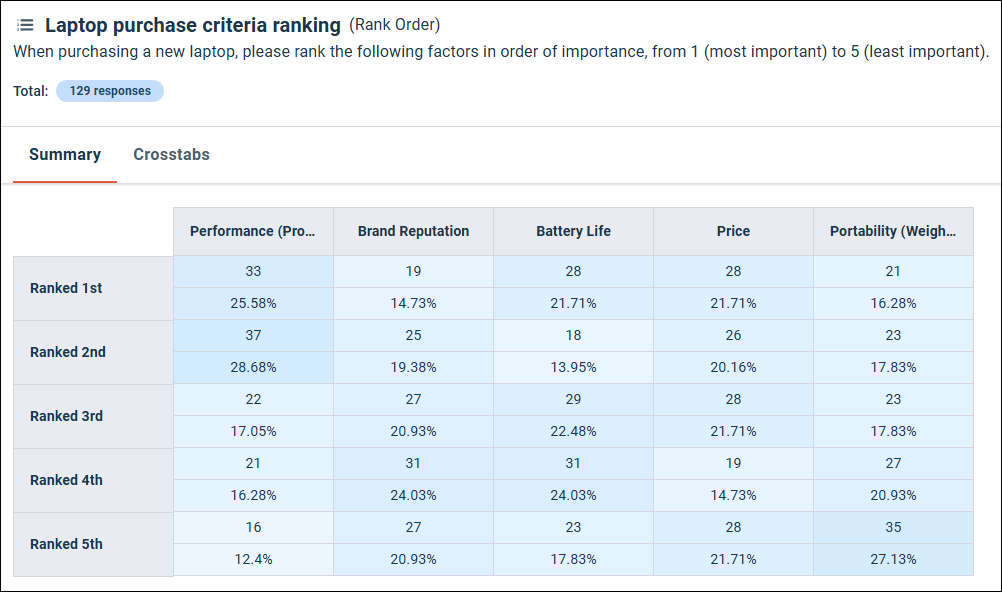
You can also configure the orientation of the Summary tab. You can either display the statements as rows and the answers or ranks as columns (the default), or the statements as columns and the answers or ranks as rows.
Answers or ranks displayed as rows
For more information on managing these tabs, see Configure grid and Rank Order question tiles.
Rank Order question display
Rank Order questions display the count and percentage of participants that selected each rank. A separate crosstab is displayed for each answer.
For example, in the following screenshot 10 participants ranked battery life as the most important (Ranked 1st) feature and 8 participants ranked it as the least important (Ranked 5th) feature.
You can choose to exclude the Didn't assign a rank row from the crosstabs in the tile settings. For more information, see Configure individual tiles in modern reports.