 Working with the AI
Assistant for reporting (beta)
Working with the AI
Assistant for reporting (beta)
The AI Assistant provides a conversational chat window for working with your report data.
Note: When you insert text or visualizations from the AI Assistant into
your report they reflect the current state of the data included in the report.
The information is not updated dynamically as more responses are added. By
default, the timestamp indicating when the text or visualization was inserted
is stored in the description of the new Text tile.
-
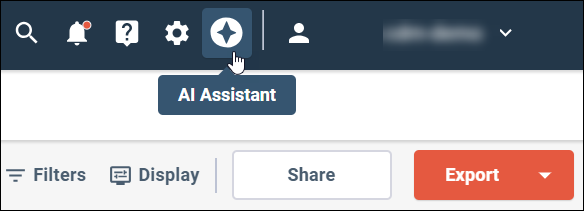
In the navigation bar, click
AI Assistant.
-
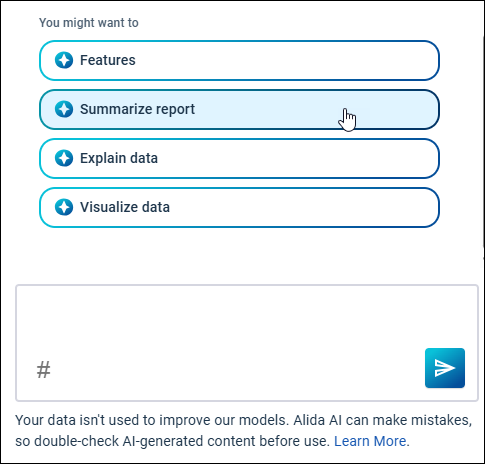
Enter a prompt or select from the predefined prompts to start your
analysis. Continue to prompt the AI Assistant to arrive at the insights you are
interested in.
The AI Assistant can analyze the report to help you to summarize the data in the report, explain the findings in individual crosstabs, and create visualizations for your report data.
For a workflow you can apply to analyze your report data, see The AI Assistant reporting workflow (beta). You can also review the best practices for working with the AI Assistant.
-
To insert all visualizations, text, and tables from an AI
Assistant response into your report, click
Insert at the bottom left of the response.
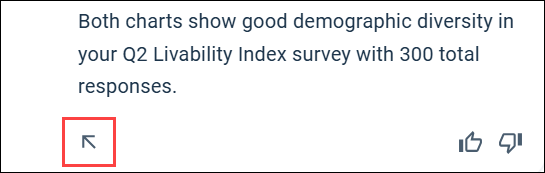
Text and tables are inserted together into a new Text tile in your report. Visualizations are inserted into separate Text tiles, with one visualization per tile.
-
To view a larger display of a visualization in your browser, click
Open in full.

-
To insert individual text blocks or visualizations from the AI
Assistant into your report:
-
For text and tables, hover over the text block to insert and
click
Insert.

-
For text and tables, hover over the text block to insert and
click
Insert.
-
To copy or download AI Assistant text or visualizations:
-
For visualizations, navigate to the visualization and click
Download and then select one of the
options.

- Download as PNG: Select the Portable Network Graphics (PNG) format in most cases when you want to download and add the visualization to a document, presentation, or web page.
- Download as SVG: Select the Scalable Vector Graphics (SVG) format when you need to scale up or down the size of the visualization without losing quality.
- Download as CSV: Select this option to download a text file with the labels and values from the visualization.
-
For text or tables, hover over the text block to copy and
click
Copy Text.

-
For visualizations, navigate to the visualization and click
Download and then select one of the
options.
-
To provide feedback to Alida on the quality of the AI Assistant's
response click
Good Response or
Bad Response at the bottom of the response
output.
