Tables and crosstabs in modern reports
While charts provide an immediate visual summary of your data, crosstabs allow you to analyze the specific numerical data behind the visualization.
You can switch between chart and table views at the report level, or for individual data tiles.
Understanding crosstabs
Questions that contain categorical answers are displayed as crosstabs in modern reports. For example, Single Choice and Multiple Choice questions, where the participant must choose from a preset list of values, are displayed as crosstab.
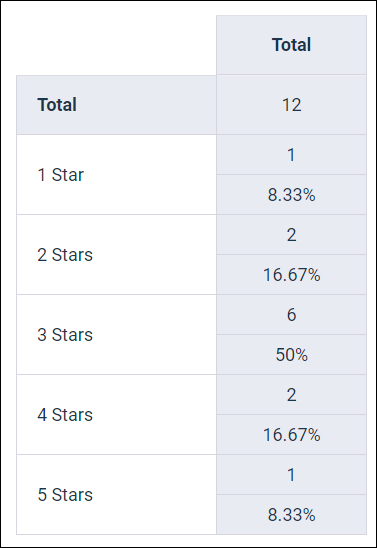
Similar to a pivot table in spreadsheet applications, the crosstab displays the total number of responses to the question, along with the count and percentage of participants that selected each option.
You can configure the display settings to show just the count, just the percentage, or both values in your report. For more information, see Configure crosstab and summary table display settings.
Crosstabs become a powerful tool for analyzing your response data when combined with banners. Banners enable you to use other questions from your survey, or profile variables, to segment the responses to discover meaningful insights. For example, you might segment a Rating question by location and discover that overall, your service is rated highly, but that one location is underperforming and needs attention.
Crosstabs can be displayed for the following question types:
- Single Choice
- Multiple Choice
- Single Choice Grid
- Multiple Choice Grid
- Number
- Rating
- Rank Order
- Allocation
For more information on Single Choice Grid, Multiple Choice Grid, and Rank Order questions, see Grid and Rank Order question views in modern reports.
Net Promoter Score℠ (NPS®)
NPS® tiles use a unique three-tab structure:
- Net Promoter
Score: Displays two crosstabs with the following information:
- The Net Promoter Score (NPS®), which is calculated by subtracting the percentage of Detractors from the percentage of Promoters. The NPS® can range from -100 (everyone is a Detractor) to 100 (everyone is a Promoter). An NPS® close to 0 means the number of Detractors and Promoters is roughly equal.
- NPS® categories, which lists the distribution of Promoter, Passive, and Detractor responses by count and percentage.
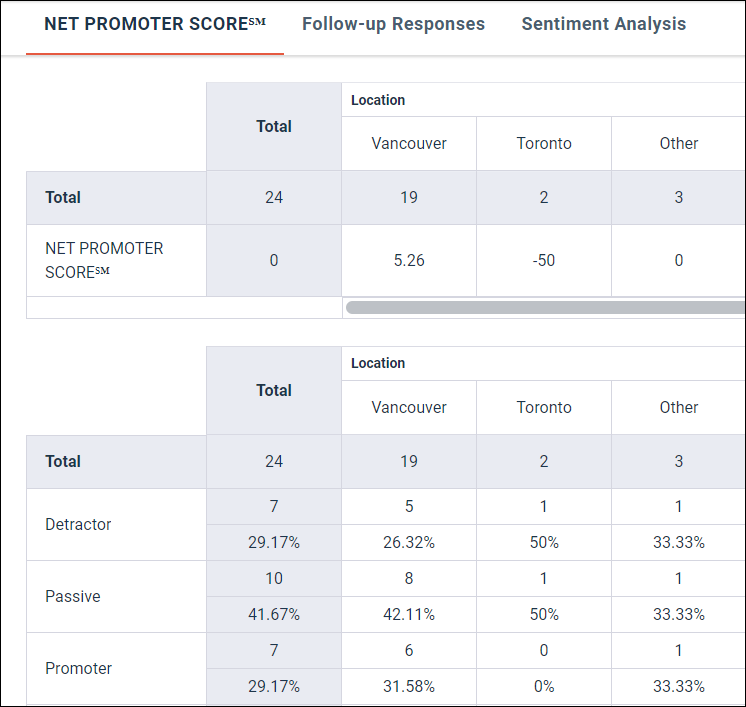
- Follow-up Responses: Lists the individual text responses alongside the associated NPS® value.
- Sentiment Analysis: When enabled, this tab analyzes the topics within the follow-up text.
Number questions
Number questions display calculations that summarize the responses. You can customize the calculations that are displayed in the crosstab by selecting any of the following calculations:
- Average (Mean)
- Median
- Min
- Max
- Mode
- Standard Deviation
- Sum
- Variance
Average is displayed by default. You can deselect it, but the crosstab must include at least one calculation.
For more information on configuring Number tiles, see Configure Number question crosstab calculations.
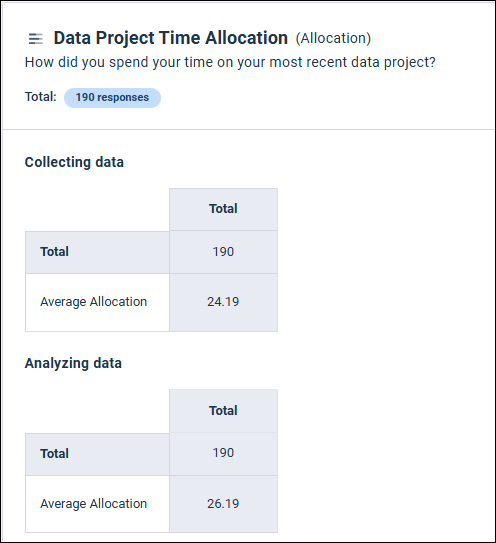
Allocation questions
Allocation questions display a separate crosstab for each answer, with the selected calculation(s) that summarize the responses for each answer. You can customize the calculations that are displayed in the crosstabs by selecting any of the following calculations:
- Average Allocation
- Median Allocation
- Min Allocation
- Max Allocation
Average Allocation and Median Allocation are displayed by default.
For more information on configuring Allocation tiles, see Configure Allocation question crosstab calculations.
Significance testing
When significance testing is applied to a question, the tile displays a custom crosstab that highlights any significant results, and a Significant Differences panel with a text description of the significant results.
For more information on interpreting significance testing results, see Examining significance test results.
Weighting
When weighting is applied to a question, the tile displays a custom crosstab that lists three rows with results that are specific to weighting.
The following three metrics are displayed:
- Weighted base: The total number of responses after weighting is applied.
- Effective base: The adjusted sample size after applying weights.
- Unweighted base: The total number of responses before weighting is applied.
The totals for each answer and the results for each banner column are displayed.
For more information on these metrics, see Interpreting weighting scheme results in modern reports.
Other/Specify answers
When you build your survey for Single Choice and Multiple Choice
questions, you can select the
Make answer other/specify option for an answer
and allow the respondent to type in their answer instead of choosing from the
predefined answers. Single Choice and Multiple Choice questions that include
one or more Other/Specify answers for the question include a separate tab for
each Other/Specify answer. Each tab includes a table with the text for each
response collected by the survey, allowing you to read through each of the
responses.
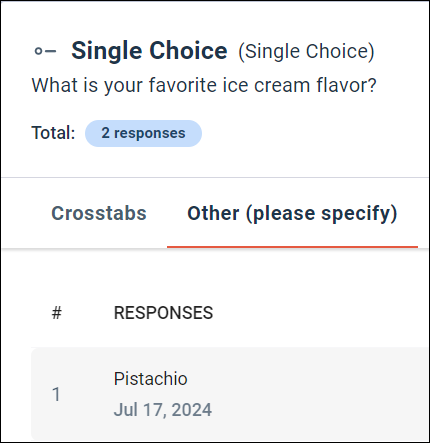
If an other/specify answer does not have label text, the tab is named Other/Specify. Otherwise, the label text of the answer is used. For example, Other (please specify).
You can browse through multiple pages of responses, if applicable, by clicking the page numbers at the bottom right of the table. You can also adjust the number of entries displayed on each page by selecting 10 (Default), 25, or 50 items from the Show ... per page drop-down list.