Switch subgroup views
View your report using different sets of subgroup definitions.
-
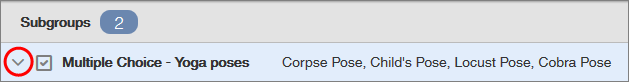
On the
Subgroups menu, click the drop-down arrow to
select a different subgroup definition.
-
Switch between chart and table views.

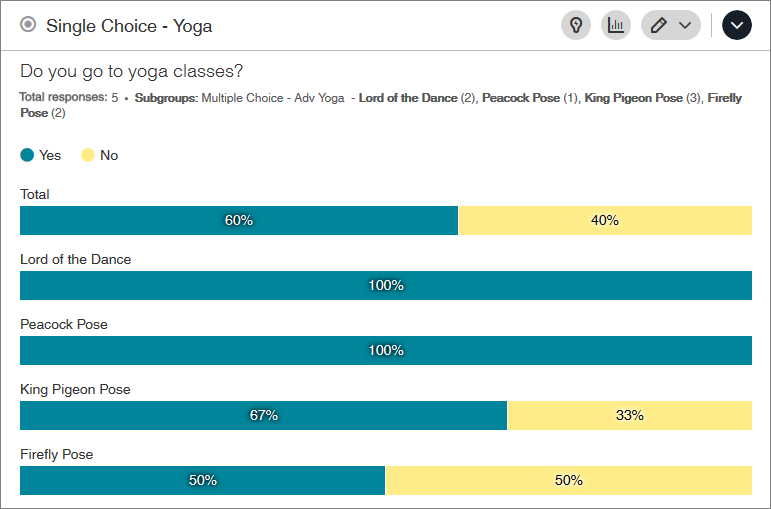
Example In the report for your yoga survey, you add another survey as subgroup definitions.
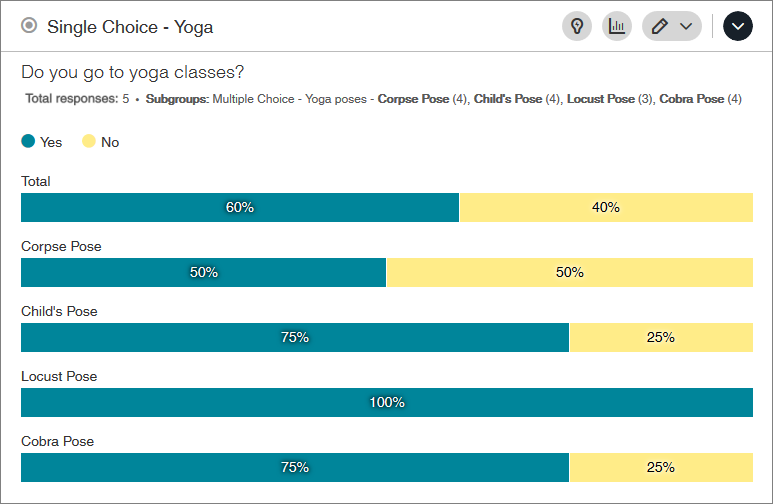
You first display the report with the beginner yoga poses subgroups applied.
You then want to see if customers who have done more advance yoga poses answered your question differently. To see this comparison, you switch subgroup views to location.