Reporting on unmoderated usability test results
Learn more about viewing unmoderated usabiity test recordings and data.
Access reporting
You can view your results in Monitor and modern reporting. Monitor displays up-to-date participation data as responses are coming in. In modern reporting though, it may take a while for recordings to become available depending on the length and complexity of the activity.
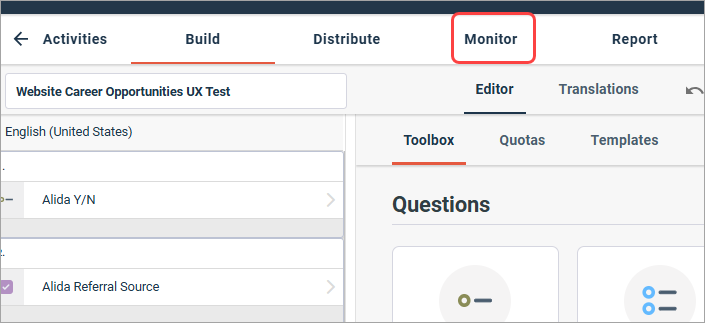
- To view participation
data, click
Monitor.
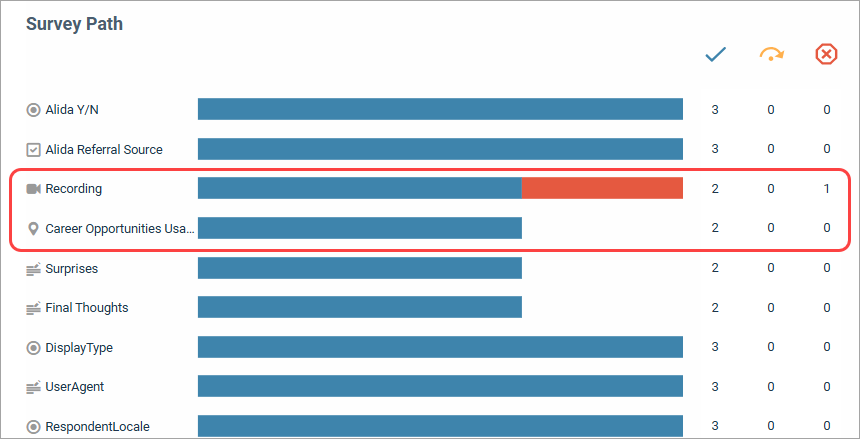
- Recording actions and
Usability Task questions are listed as part of the survey path. Completion,
skip, and stop point information is displayed for each of them.
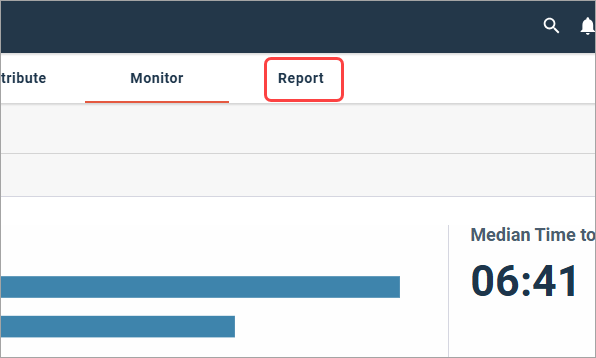
- To view response data,
click
Report.
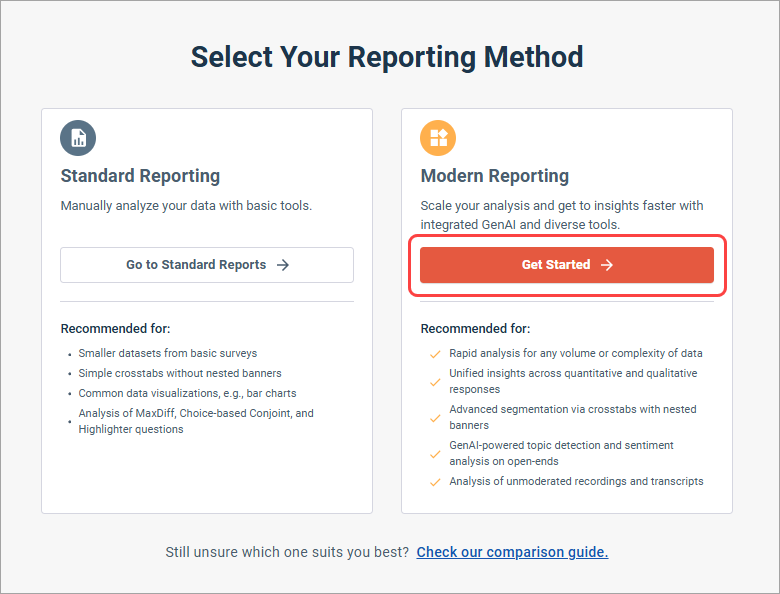
- Under
Modern Reporting, click
Get Started.
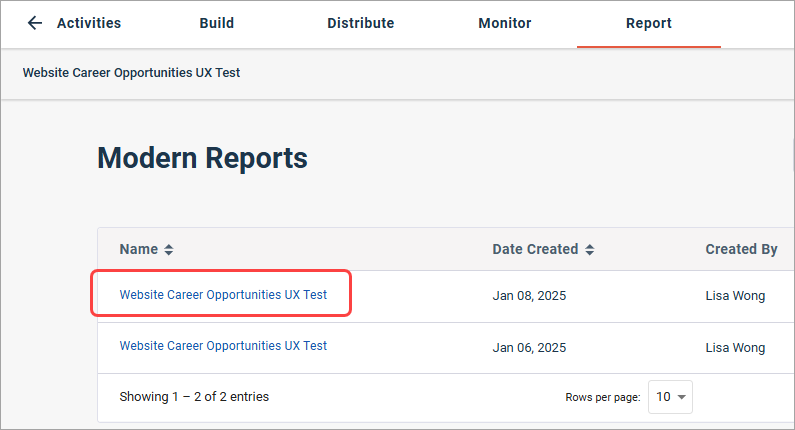
- Create a new modern report
or open an existing one.
View recordings and transcripts
-
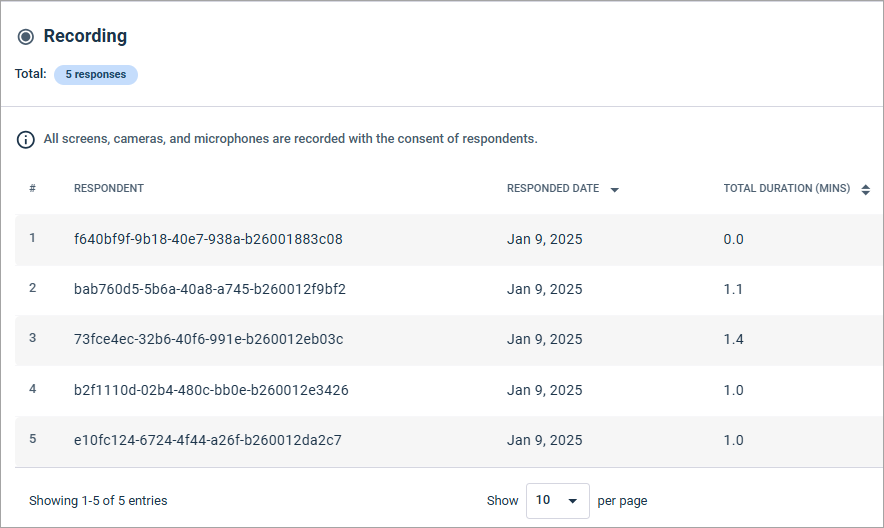
Scroll down to the Recording action's tile.
Here you can see how many responses were received, as well as a list of all responses. For each response, the following information is displayed:
- Respondent
- Responded Date
- Total Duration (Mins)
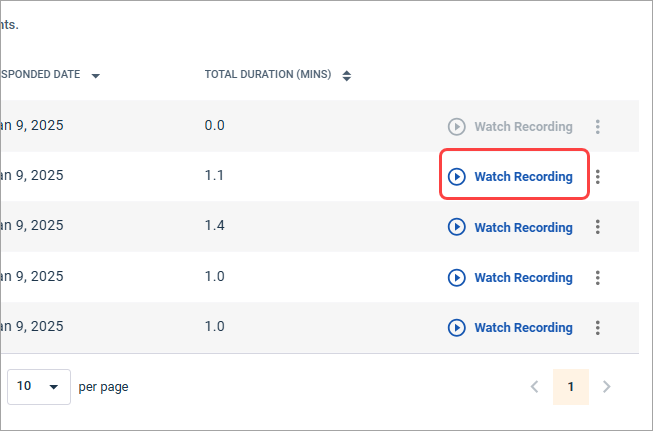
- Click
Watch Recording.
-
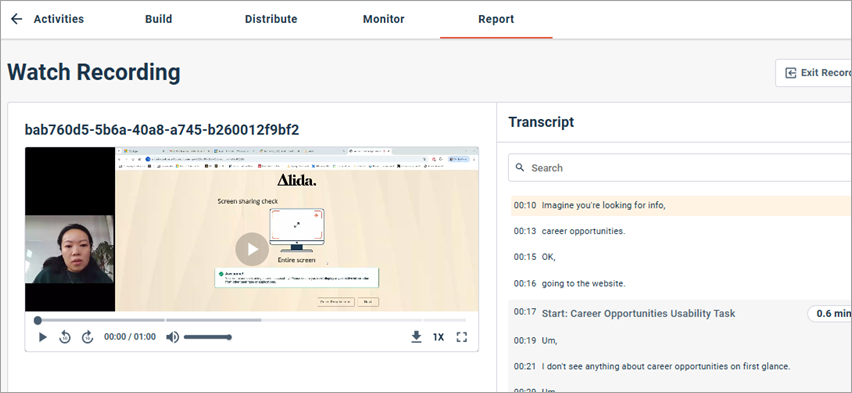
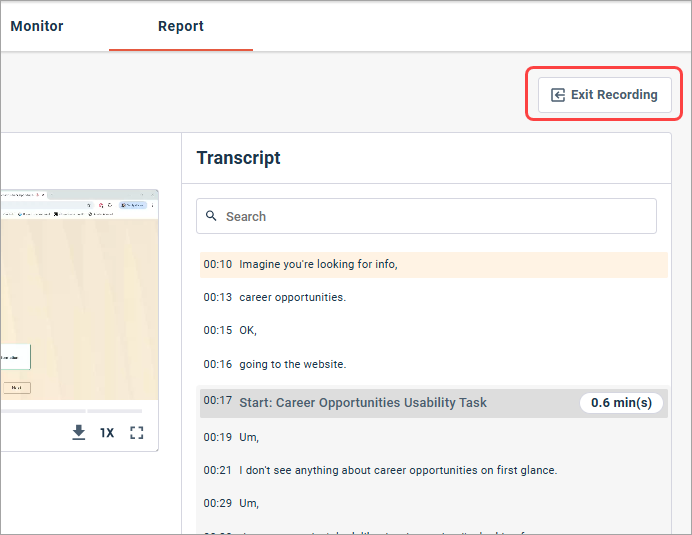
The Watch Recording page displays the video recording on the left side. Camera footage of the participant's face appears beside the screen recording.
 Tip:
Tip:Watch for facial expressions, non-verbal reactions, and other body language cues as you replay the footage. These are rich context clues that complement the screen recording and audio.
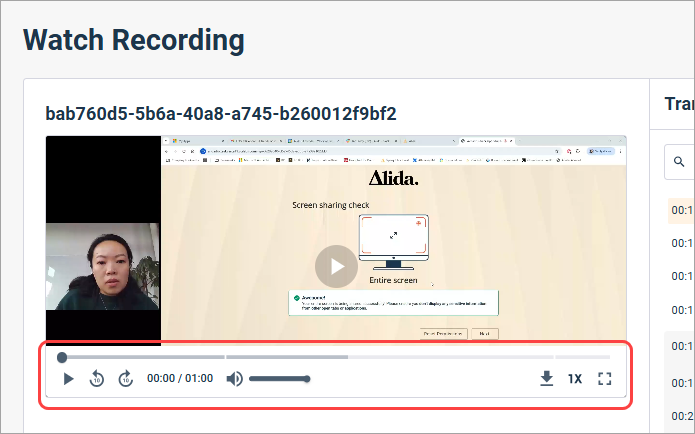
- Use the controls in the
video player to:
- Rewind
- Fast forward
- Adjust volume
- Download the recording
- Adjust the playback speed
- Enter and exit fullscreen mode
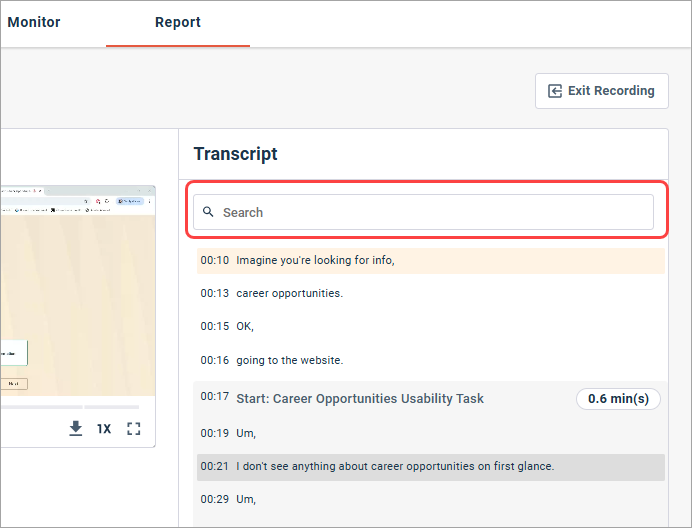
- In the
Transcript section, use the search field to look for key
terms in the recording's audio transcript. Beside the search field, click
Download Transcript to download the TXT file.
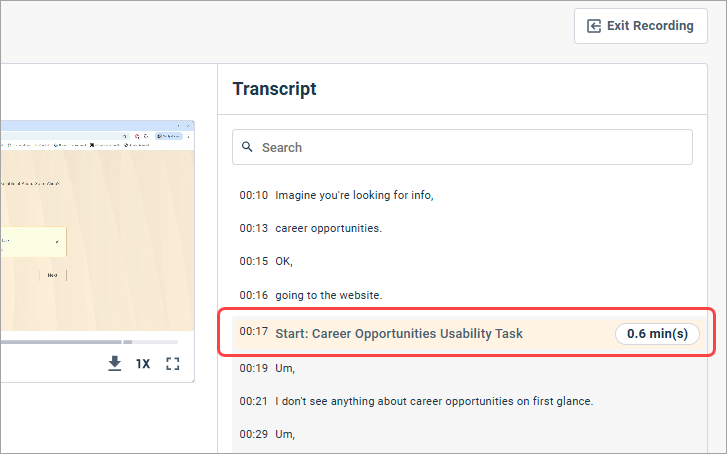
- Alternately, click the
timestamp next to something in the transcript. This will cause the video to
skip to that exact moment.
- When you are finished,
click
Exit Recording.
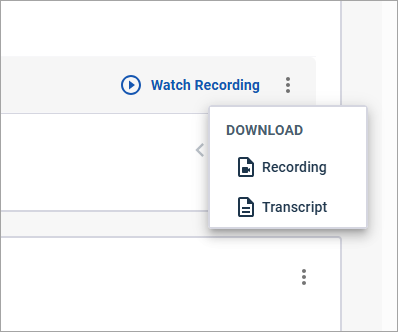
- Back in the list of
responses, you can click the options menu beside each
Watch Recording link to download the recording
as an MP4 file, or download the transcript as a TXT file.
View Figma Usability Task metrics
-
Scroll to the Usability Task question tile.
On the Summary tab, you can see these top-level metrics:
Metric Description Success Rate The number of responses that achieved direct or indirect success, divided by the total number of responses. Average Duration The average amount of time someone spent on the Usability Task question, regardless of whether or not they succeeded at the task. Misclicks The number of clicks outside a hotspot, divided by the total number of clicks. 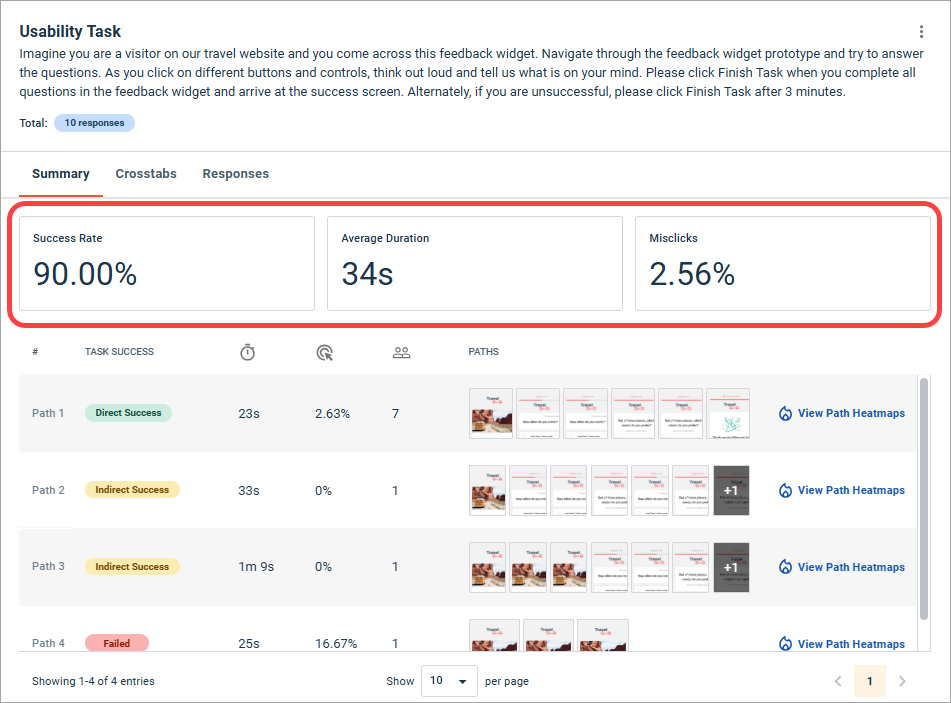
-
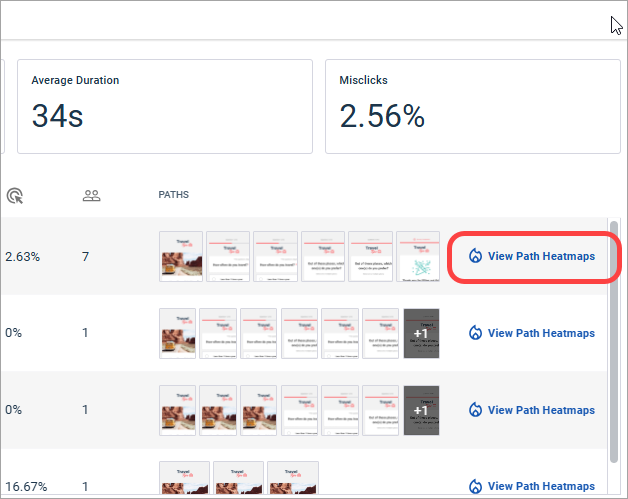
Below the top-level metrics, you can see all the possible paths taken by participants. For each path, the following information is listed:
Metric Description Task success The success status of the path. These options are possible: - Direct Success: Applies to path-based goals. This is the prescribed path.
- Indirect Success: Applies to path-based goals. This is a path that deviated from the prescribed path, but participants still finished the task.
- Success: Applies to end screen-based goals. The participants reached the defined end screen.
- Failure: Applies to both types of goals. The participants failed to complete the task.
Average duration The average amount of time participants spent on the path. Misclicks The number of clicks outside of a defined hotspot on this path, expressed as a percentage of all clicks. Number of participants The number of participants who chose this path. In the Paths column, you can see thumbnails that represent the progression of screens in each path. You can click a thumbnail to open the heatmap.
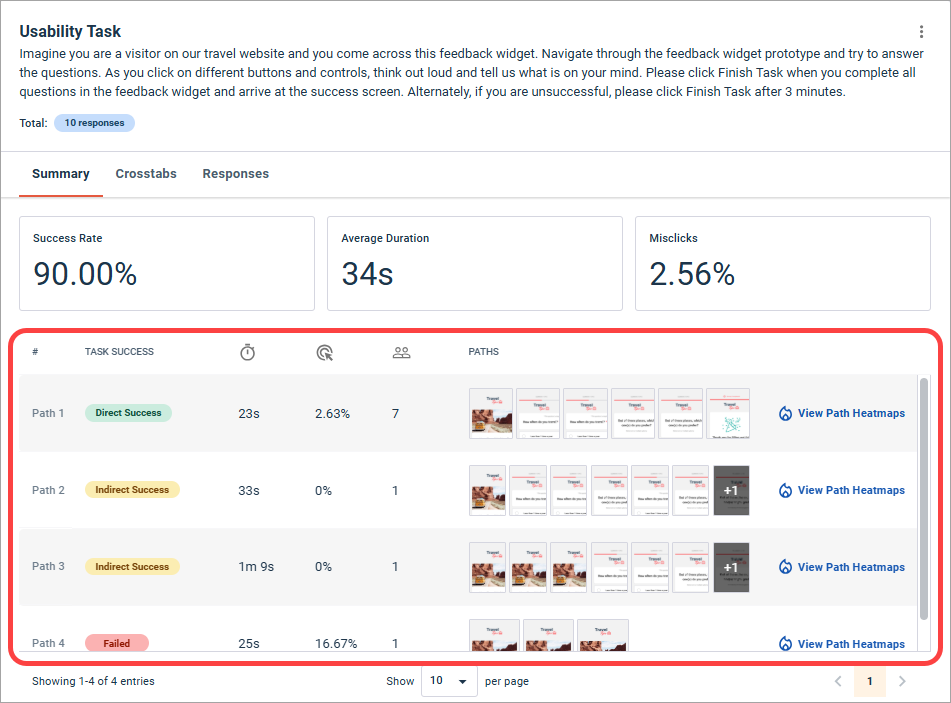
- Click
View Path Heatmaps.
- The Path
Heatmaps show where participants clicked.
- Purple represents a single click. After purple, the color scale goes from green (a few clicks) to yellow (more clicks), orange (even more clicks), and red (the most clicks).
- Click Desktop or Mobile to toggle between views.
- To navigate between screens, click Previous and Next in the upper right corner, or click the arrow buttons to the left and right.
- When you are finished, click Exit Heatmaps.
Note: Heatmaps are not available when accessing a report through a share link.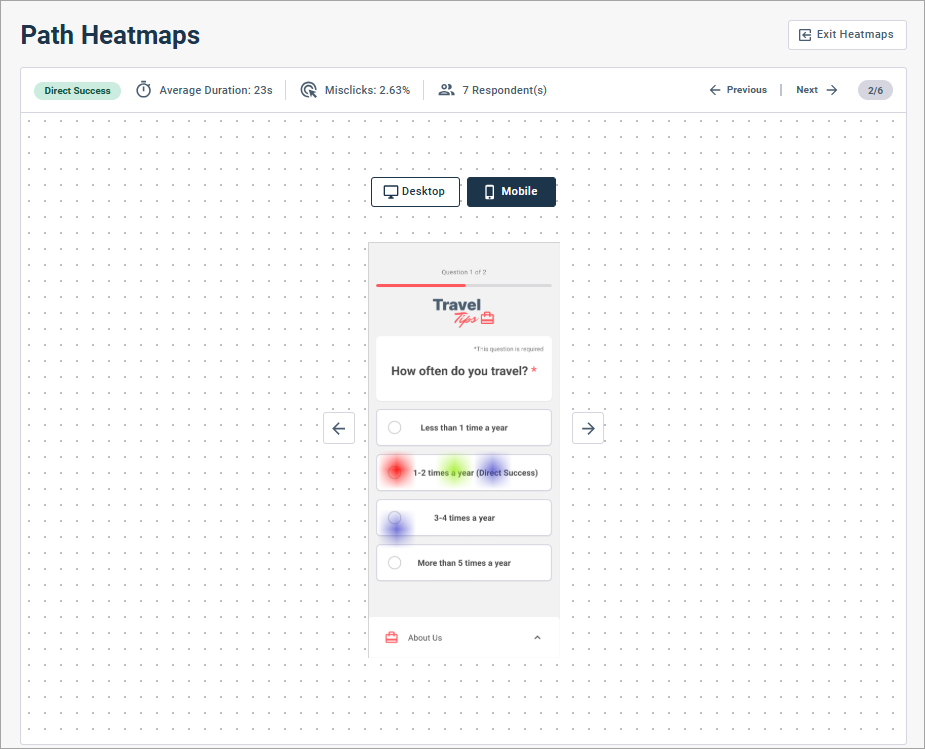
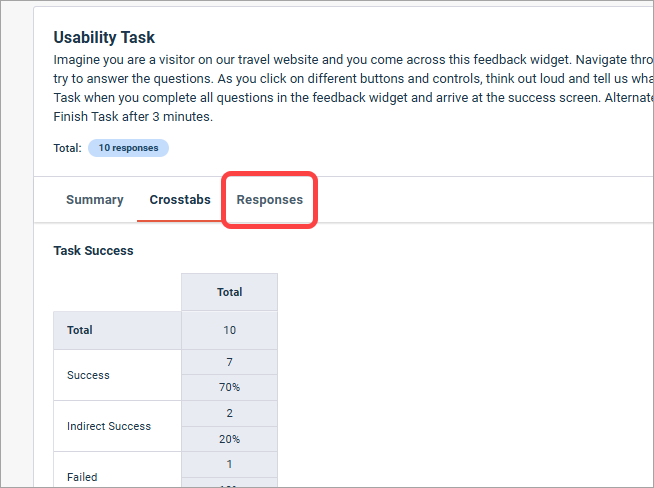
- Now let's see what else is
in the Usability Task question tile. Click
Crosstabs.
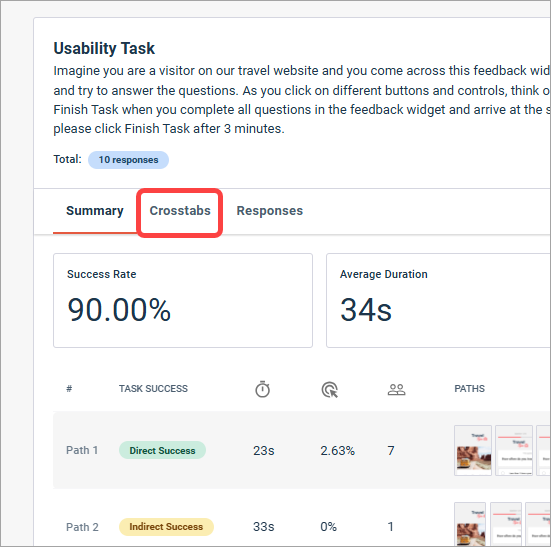
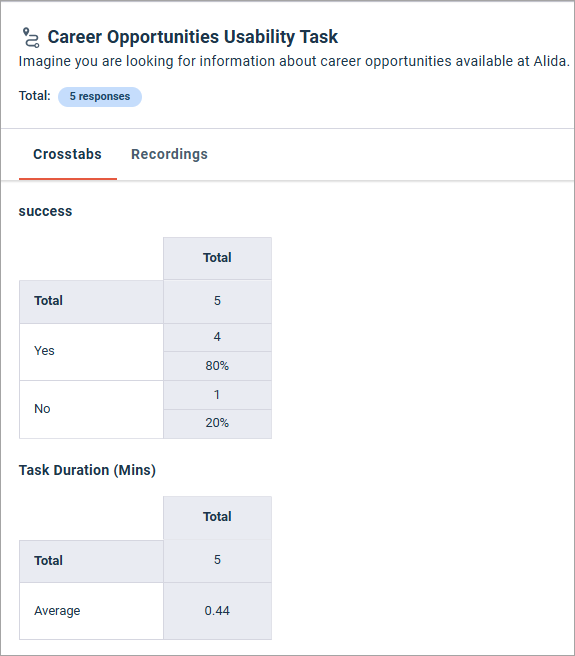
- Crosstabs displays
key metrics regarding task success, task duration, and misclicks.
Table 1. Task Success Metric Description Direct Success Applies to path-based goals. The number of participants who completed the task by following the prescribed path. Indirect Success Applies to path-based goals. The number of participants who did not follow the prescribed path, but still completed the task. Success Applies to end screen-based goals. The number of participants who completed the task by reaching the end screen. Failed Applies to both types of goals. The number of participants who did not complete the task. Table 2. Task Duration (mins) Metric Description Min The least amount of time a participant spent on the task. Average The average amount of time a participant spent on a task. Max The highest amount of time a participant spent on a task. Table 3. Misclicks Metric Description Average The number of times participants clicked outside a defined hotspot, divided by the number of total clicks. 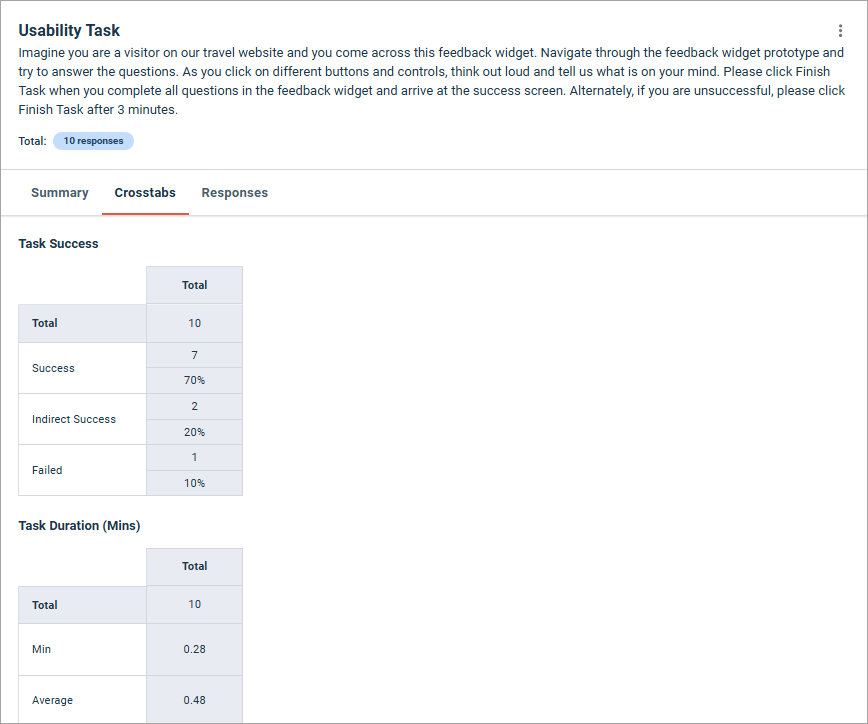
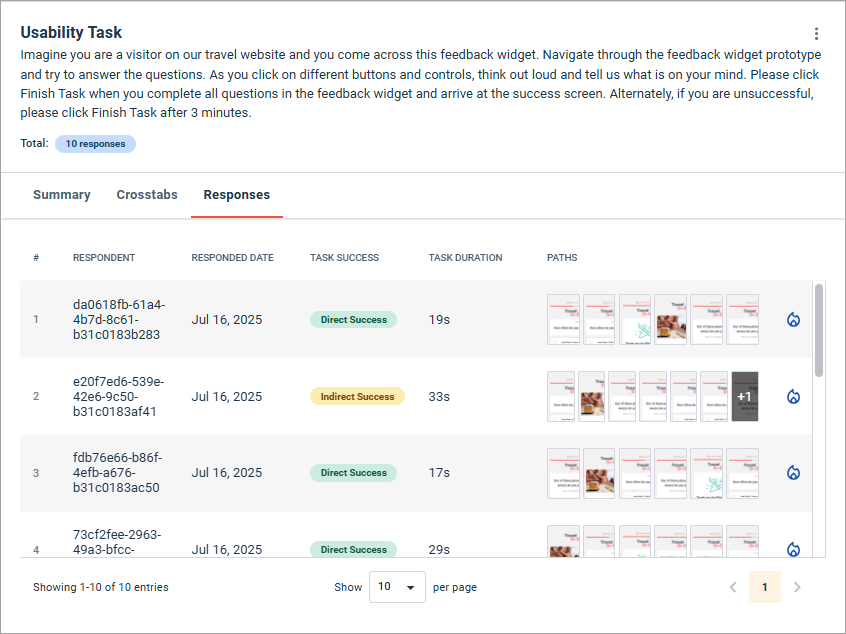
- Click
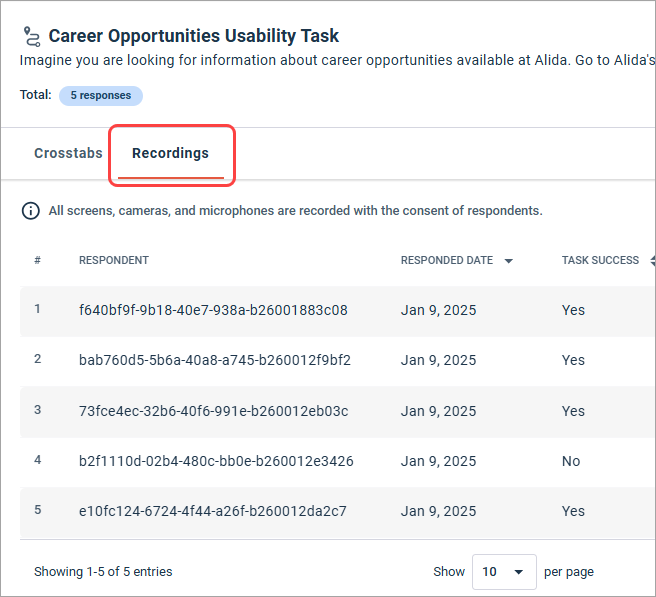
Responses to view individual responses.
- For each response, the
following information is displayed:
- Respondent ID
- Response date
- Task success status
- Task duration
- Path thumbnails
You can click a thumbnail to open the heatmap.
- Click the heatmap icon to
the right of a response listing to view the heatmaps for that individual
response.
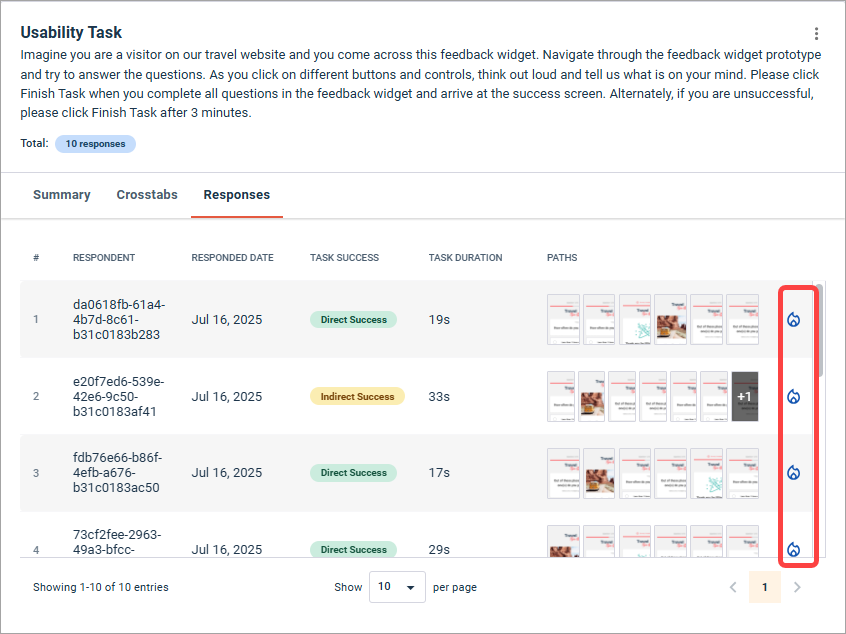
- The individual heatmap path
shows where the participant clicked.
- Red spots indicate where a click occurred.
- Click Desktop or Mobile to toggle between views.
- To navigate between screens, click Previous and Next in the upper right corner, or click the arrow buttons to the left and right. You can also click the thumbnails at the bottom.
- When you are finished, click Exit Heatmaps.
Note: Heatmaps are not available when accessing a report through a share link.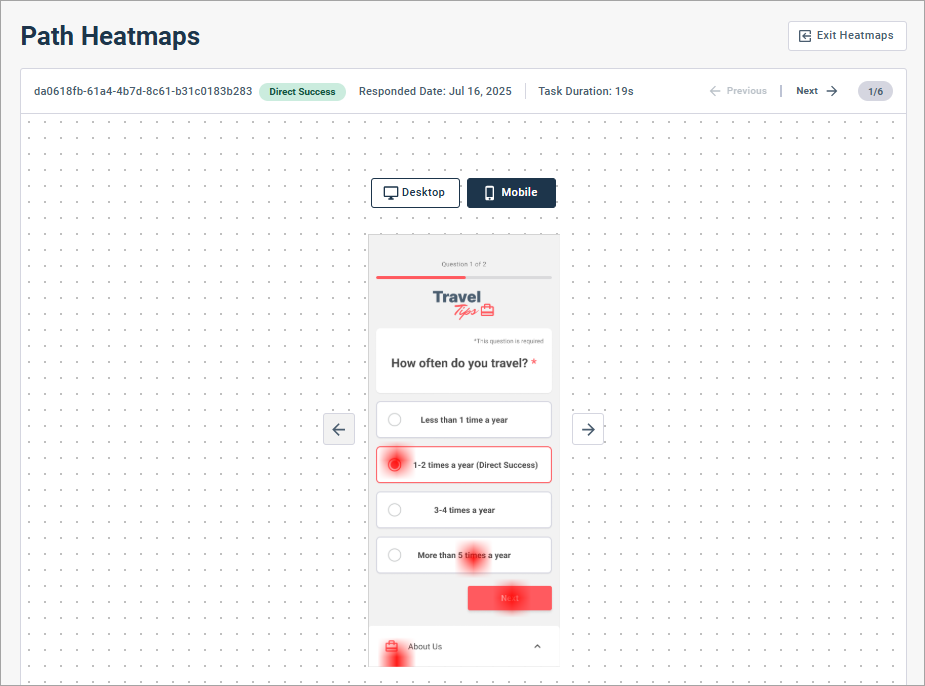
View Website Usability Task metrics
-
Scroll to the Usability Task question tile.
On the Crosstabs tab, you can see:
- A summary view of the task success question responses
- The average task
duration in minutes
Tip:
How is task duration calculated?
Task duration starts when participants click Open in new tab, and ends when they answer the task success question. If the task success question isn't shown, task duration ends when participants click Next.
- Clicking
Recordings in the Usability Task question's
tile will take you to a list of responses similar to the one in the Recording
action's tile.
-
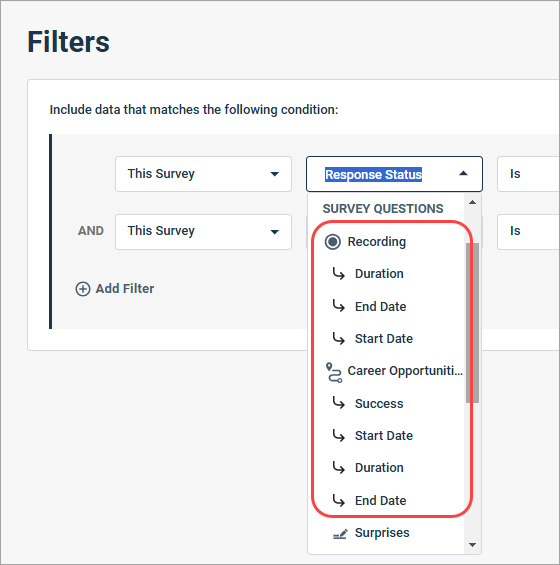
Use the Recording action or Usability Task question to build filter conditions.
For the Recording action, you can use:
- Duration
- End Date
- Start Date
For the Usability Task question, you can use:
- Success
- Start Date
- Duration
- End Date